Calculate degree measures
Degree is another thing with stuff and things.
# sphinx_gallery_thumbnail_number = 5
Start with the necessary imports
import os.path as op

import numpy as np
import seaborn as sns
import matplotlib.pyplot as plt

from brainconn import degree, utils
Get some data
corr = np.loadtxt(op.join(utils.get_resource_path(), 'example_corr.txt'))

# Zero diagonal
adj_wei = corr - np.eye(corr.shape[0])
adj_wei_dir = adj_wei + (np.triu(adj_wei) / 2)
adj_bin = utils.binarize(utils.threshold_proportional(adj_wei, 0.2))
adj_bin_dir = utils.binarize(utils.threshold_proportional(adj_wei_dir, 0.2))
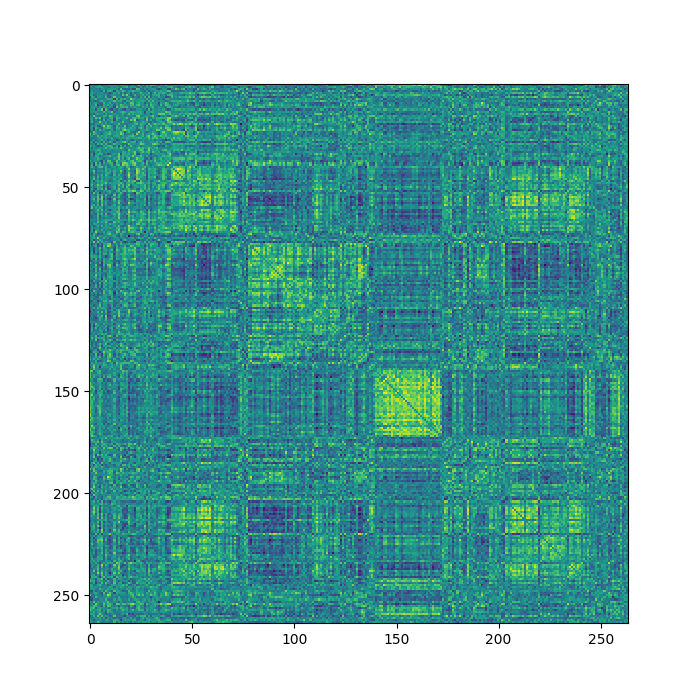
Look at weighted undirected adjacency matrix
fig, ax = plt.subplots(figsize=(7, 7))
ax.imshow(adj_wei)
fig.show()
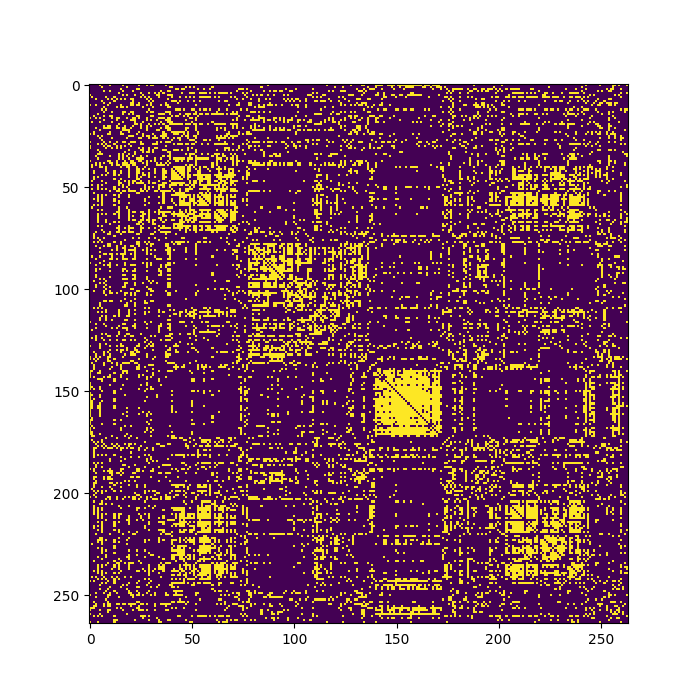
Look at binary undirected adjacency matrix
fig, ax = plt.subplots(figsize=(7, 7))
ax.imshow(adj_bin)
fig.show()
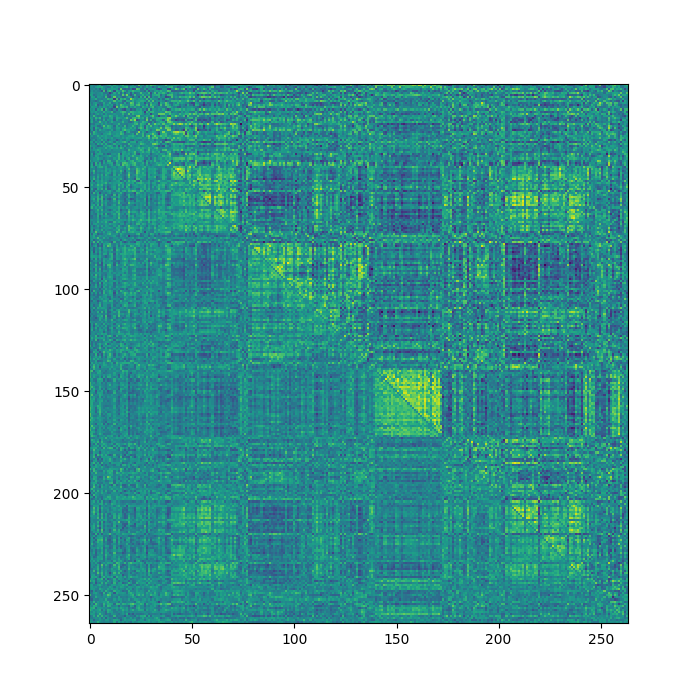
Look at weighted directed adjacency matrix
fig, ax = plt.subplots(figsize=(7, 7))
ax.imshow(adj_wei_dir)
fig.show()
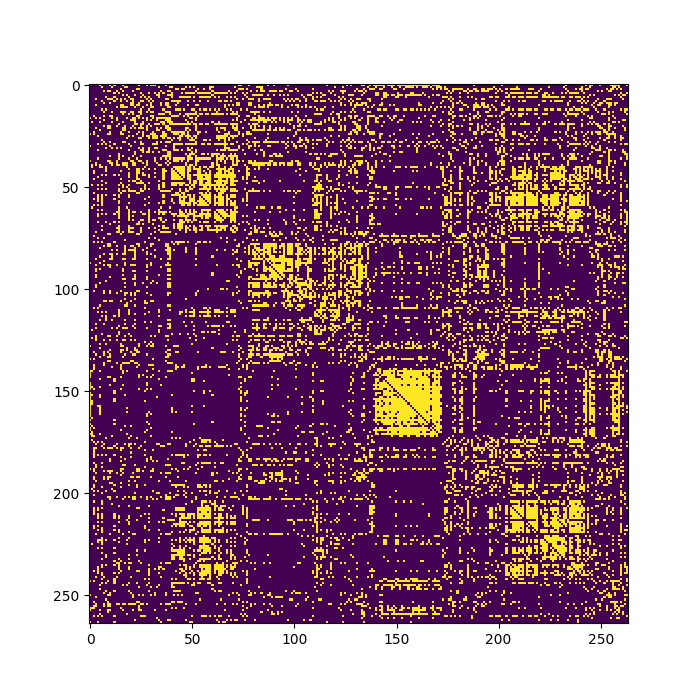
Look at binary directed adjacency matrix
fig, ax = plt.subplots(figsize=(7, 7))
ax.imshow(adj_bin_dir)
fig.show()
Compute stuff
degr_und = degree.degrees_und(adj_bin)
_, _, degr_dir = degree.degrees_dir(adj_bin_dir)
jdeg_bin, _, _, _ = degree.jdegree(adj_bin_dir)
stre_und = degree.strengths_und(adj_wei)
_, stre_und_neg, _, _ = degree.strengths_und_sign(adj_wei)
stre_dir = degree.strengths_dir(adj_wei_dir)
jdeg_wei, _, _, _ = degree.jdegree(adj_wei_dir)
jdeg_bin = jdeg_bin[jdeg_bin > 0]
jdeg_wei = jdeg_wei[jdeg_wei > 0]
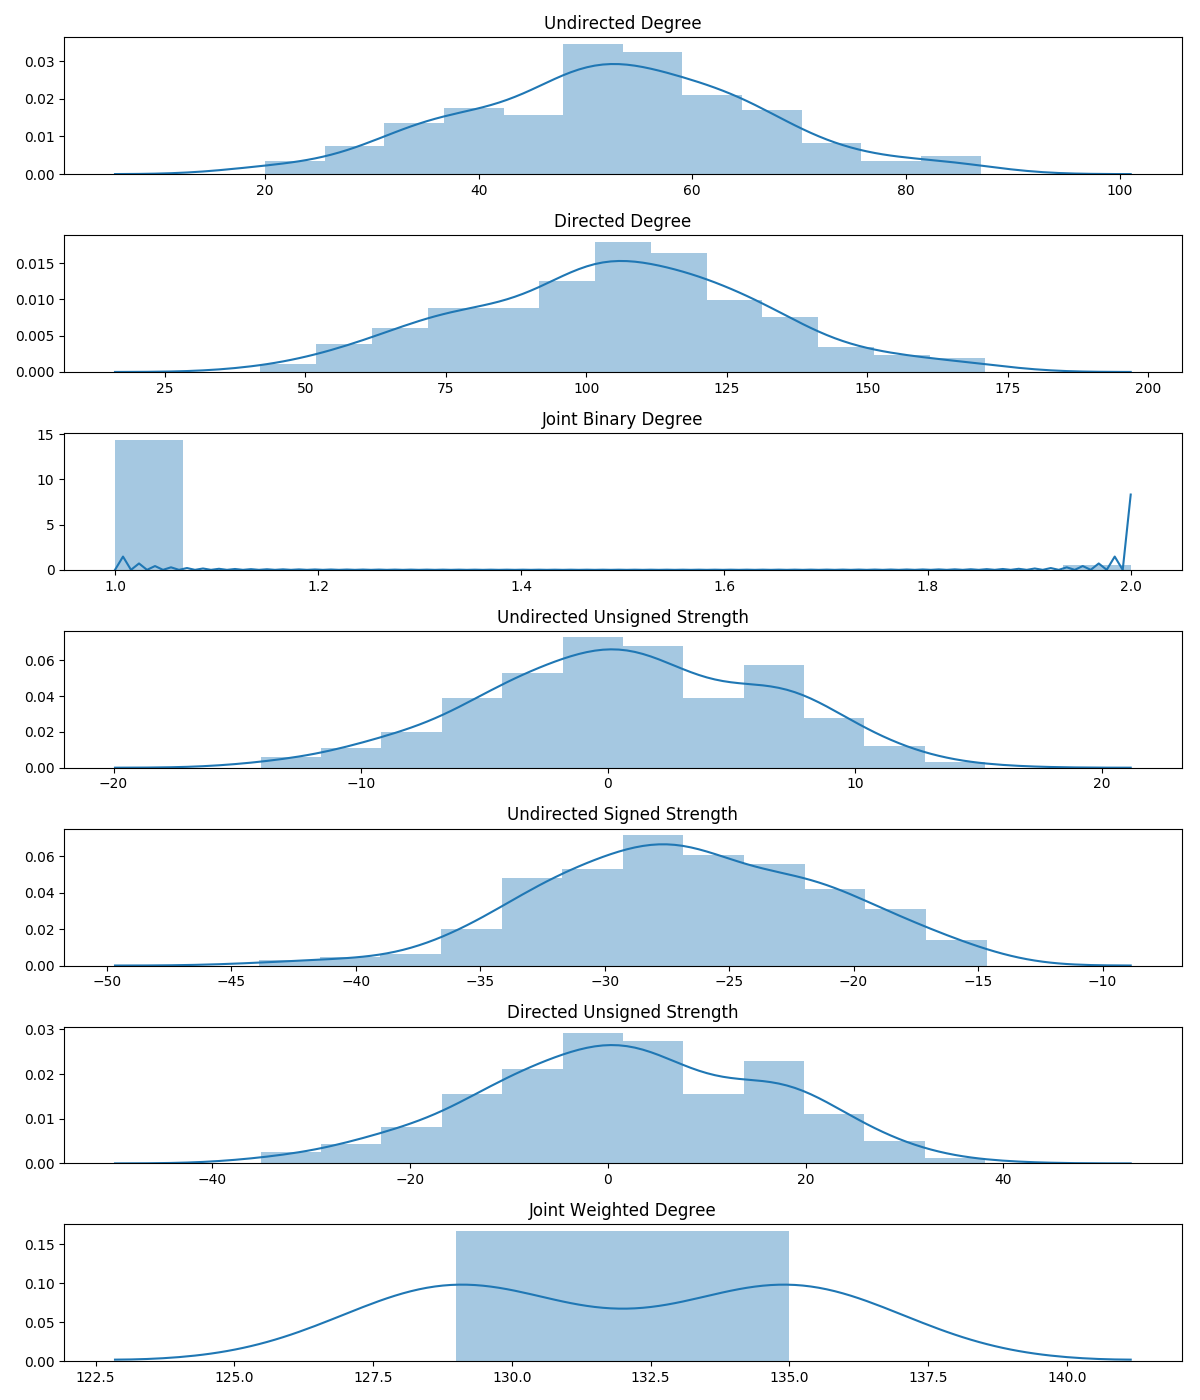
vals = [degr_und, degr_dir, jdeg_bin, stre_und, stre_und_neg, stre_dir,
jdeg_wei]
names = ['Undirected Degree',
'Directed Degree',
'Joint Binary Degree',
'Undirected Unsigned Strength',
'Undirected Signed Strength',
'Directed Unsigned Strength',
'Joint Weighted Degree']
fig, axes = plt.subplots(nrows=len(names), figsize=(12, 2*len(names)))
for i in range(len(names)):
sns.distplot(vals[i], ax=axes[i])
axes[i].set_title(names[i])
fig.tight_layout()
fig.show()
Total running time of the script: ( 0 minutes 0.602 seconds)